

Using Eye Tracking Software to Understand User Behavior: Angi Cost Guides
My Role
I led this pilot study end-to-end, including research design, methodology selection, participant recruitment, moderation, biometric data analysis, synthesis, stakeholder management, and storytelling. I partnered closely with product, design, and content teams to ensure findings could directly inform the future content strategy of the cost guide pages.
The Challenge
Angi’s cost guides are among the most highly trafficked pieces of content on the platform and play a critical role in helping homeowners move from research to action. However, open questions remained around:
How users actually engage with cost guide content
Whether the guides effectively build trust and confidence in the Angi product
If users notice and understand the cost localization tools (cost calculator)
How emotional responses influence decision-making and CTA interaction
Additionally, this project served as a pilot to evaluate the iMotions software, a new eye tracking and facial recognition tool, and determine its value and limitations for future research efforts.
The Process
Methodology
I designed a mixed-methods pilot study using iMotions remote data collection software combining:
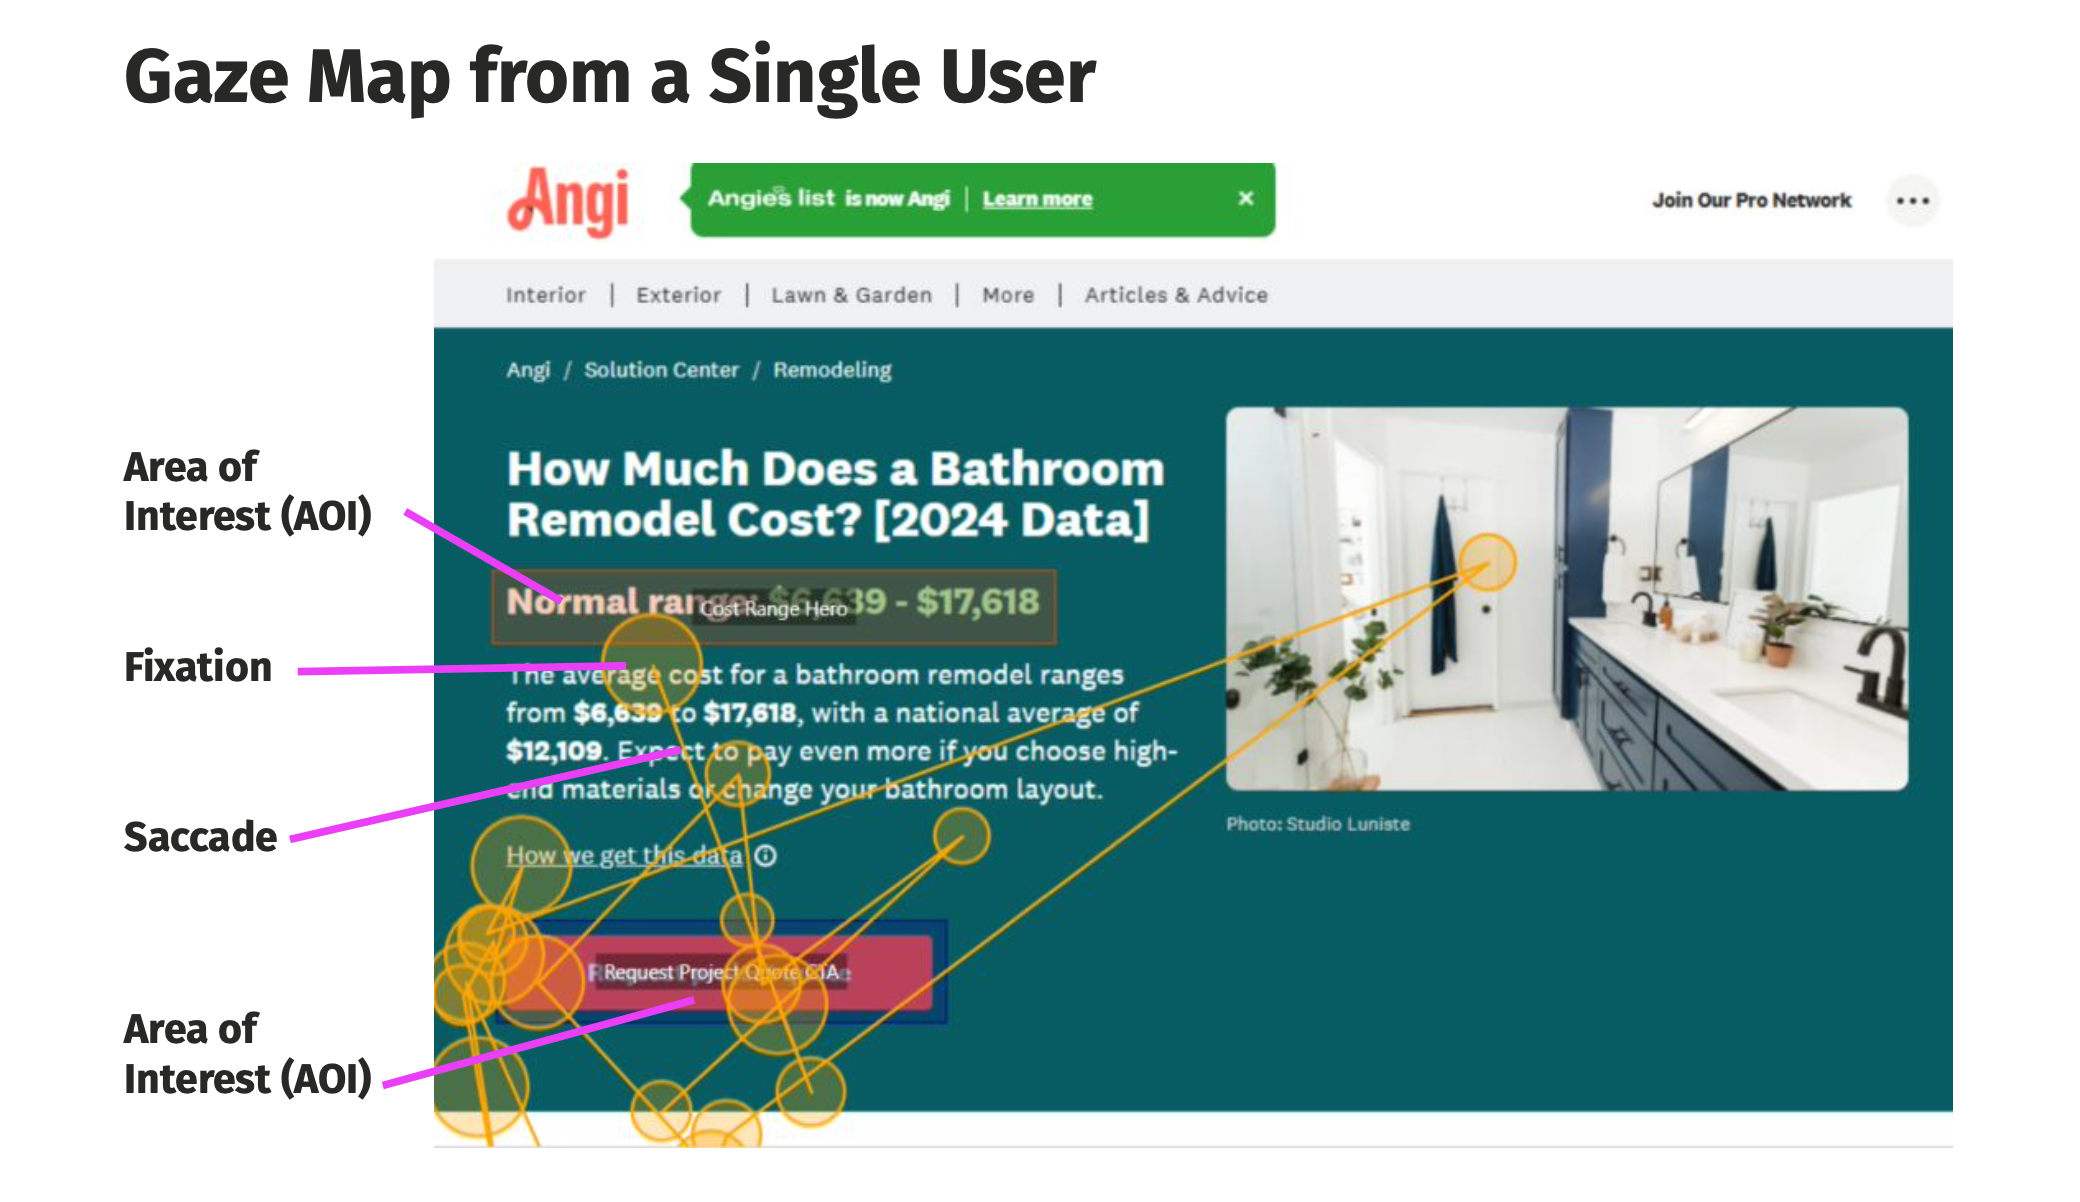
Eye tracking (fixation, dwell time, AOIs (areas of interest)
Facial expression analysis (emotional response)
Qualitative interviews and task-based feedback
Quantitative metrics
Research Focus Areas
Reading and scanning behavior across long-form content
Engagement with cost breakdowns, tables, and infographics
Visibility and comprehension of the price localization widget
Emotional reactions to cost information and CTAs
Perceived trustworthiness and credibility of pricing data.
Analysis and Synthesis
I analyzed biometric data alongside qualitative feedback from remote usability testing to identify patterns in attention, comprehension, and emotional response. Findings were synthesized into clear insights and recommendations, balancing behavioral data with user-reported perceptions.
Key Insights
Users skimmed content in a classic F-Shaped reading pattern, spending most of their attention in the top third of the page.
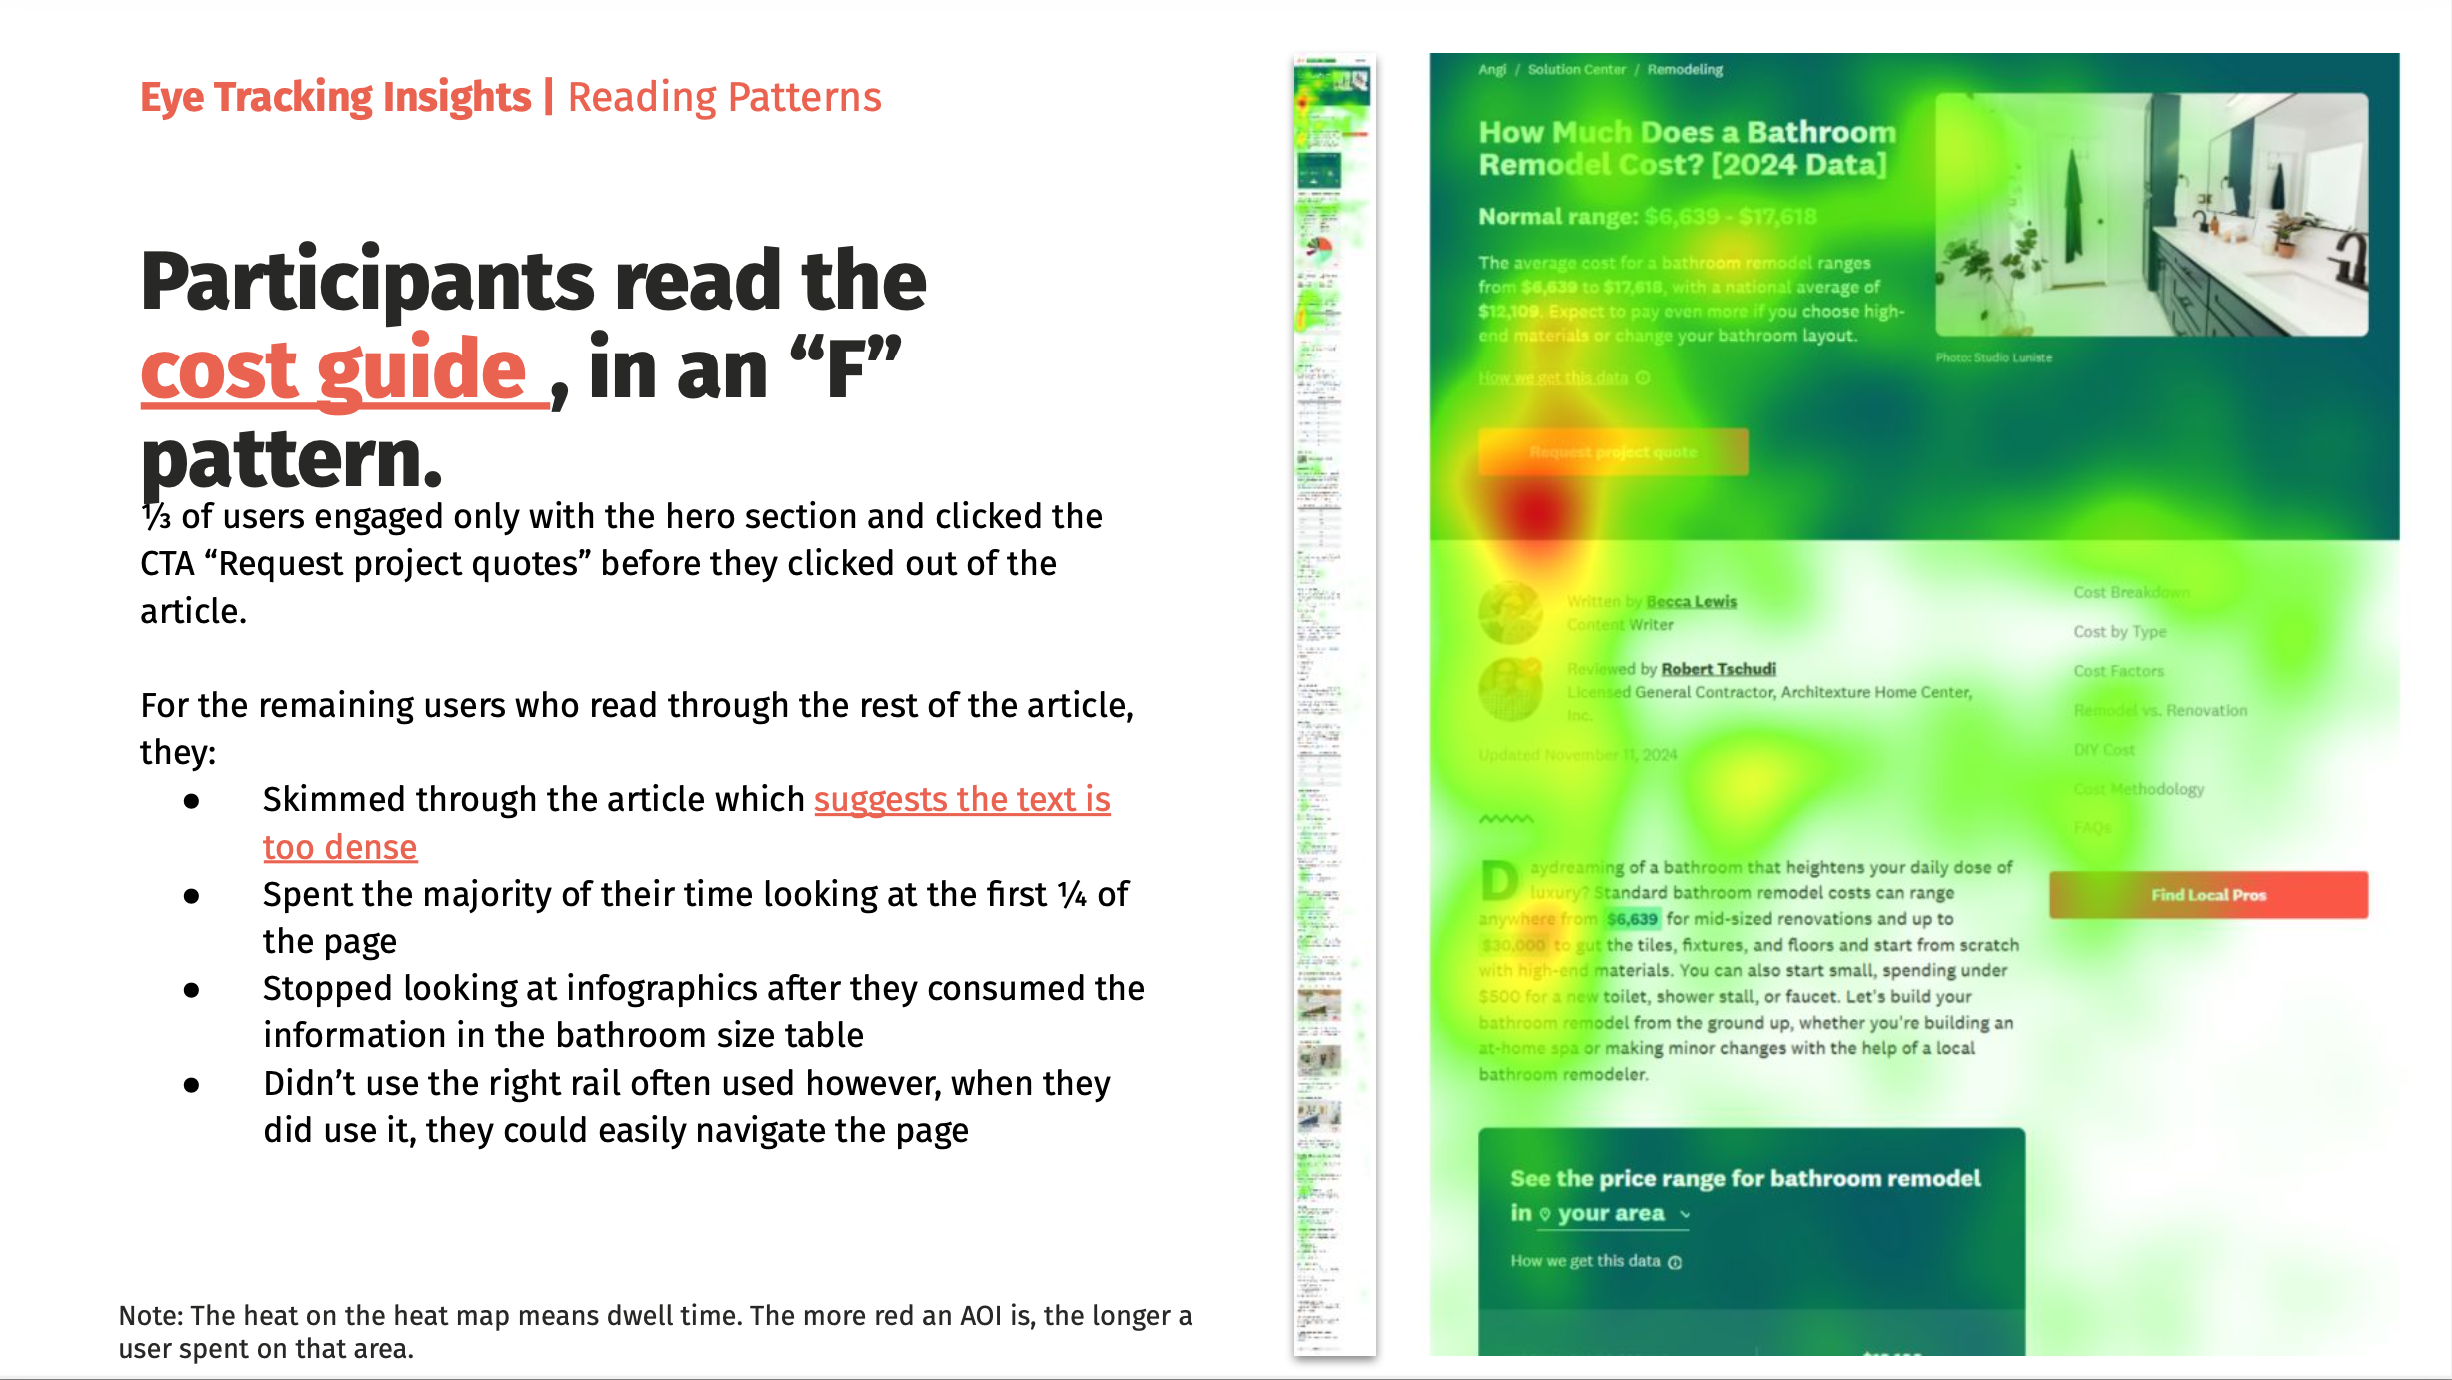
Cost breakdown tables and infographics performed well, while dense text led to disengagement.
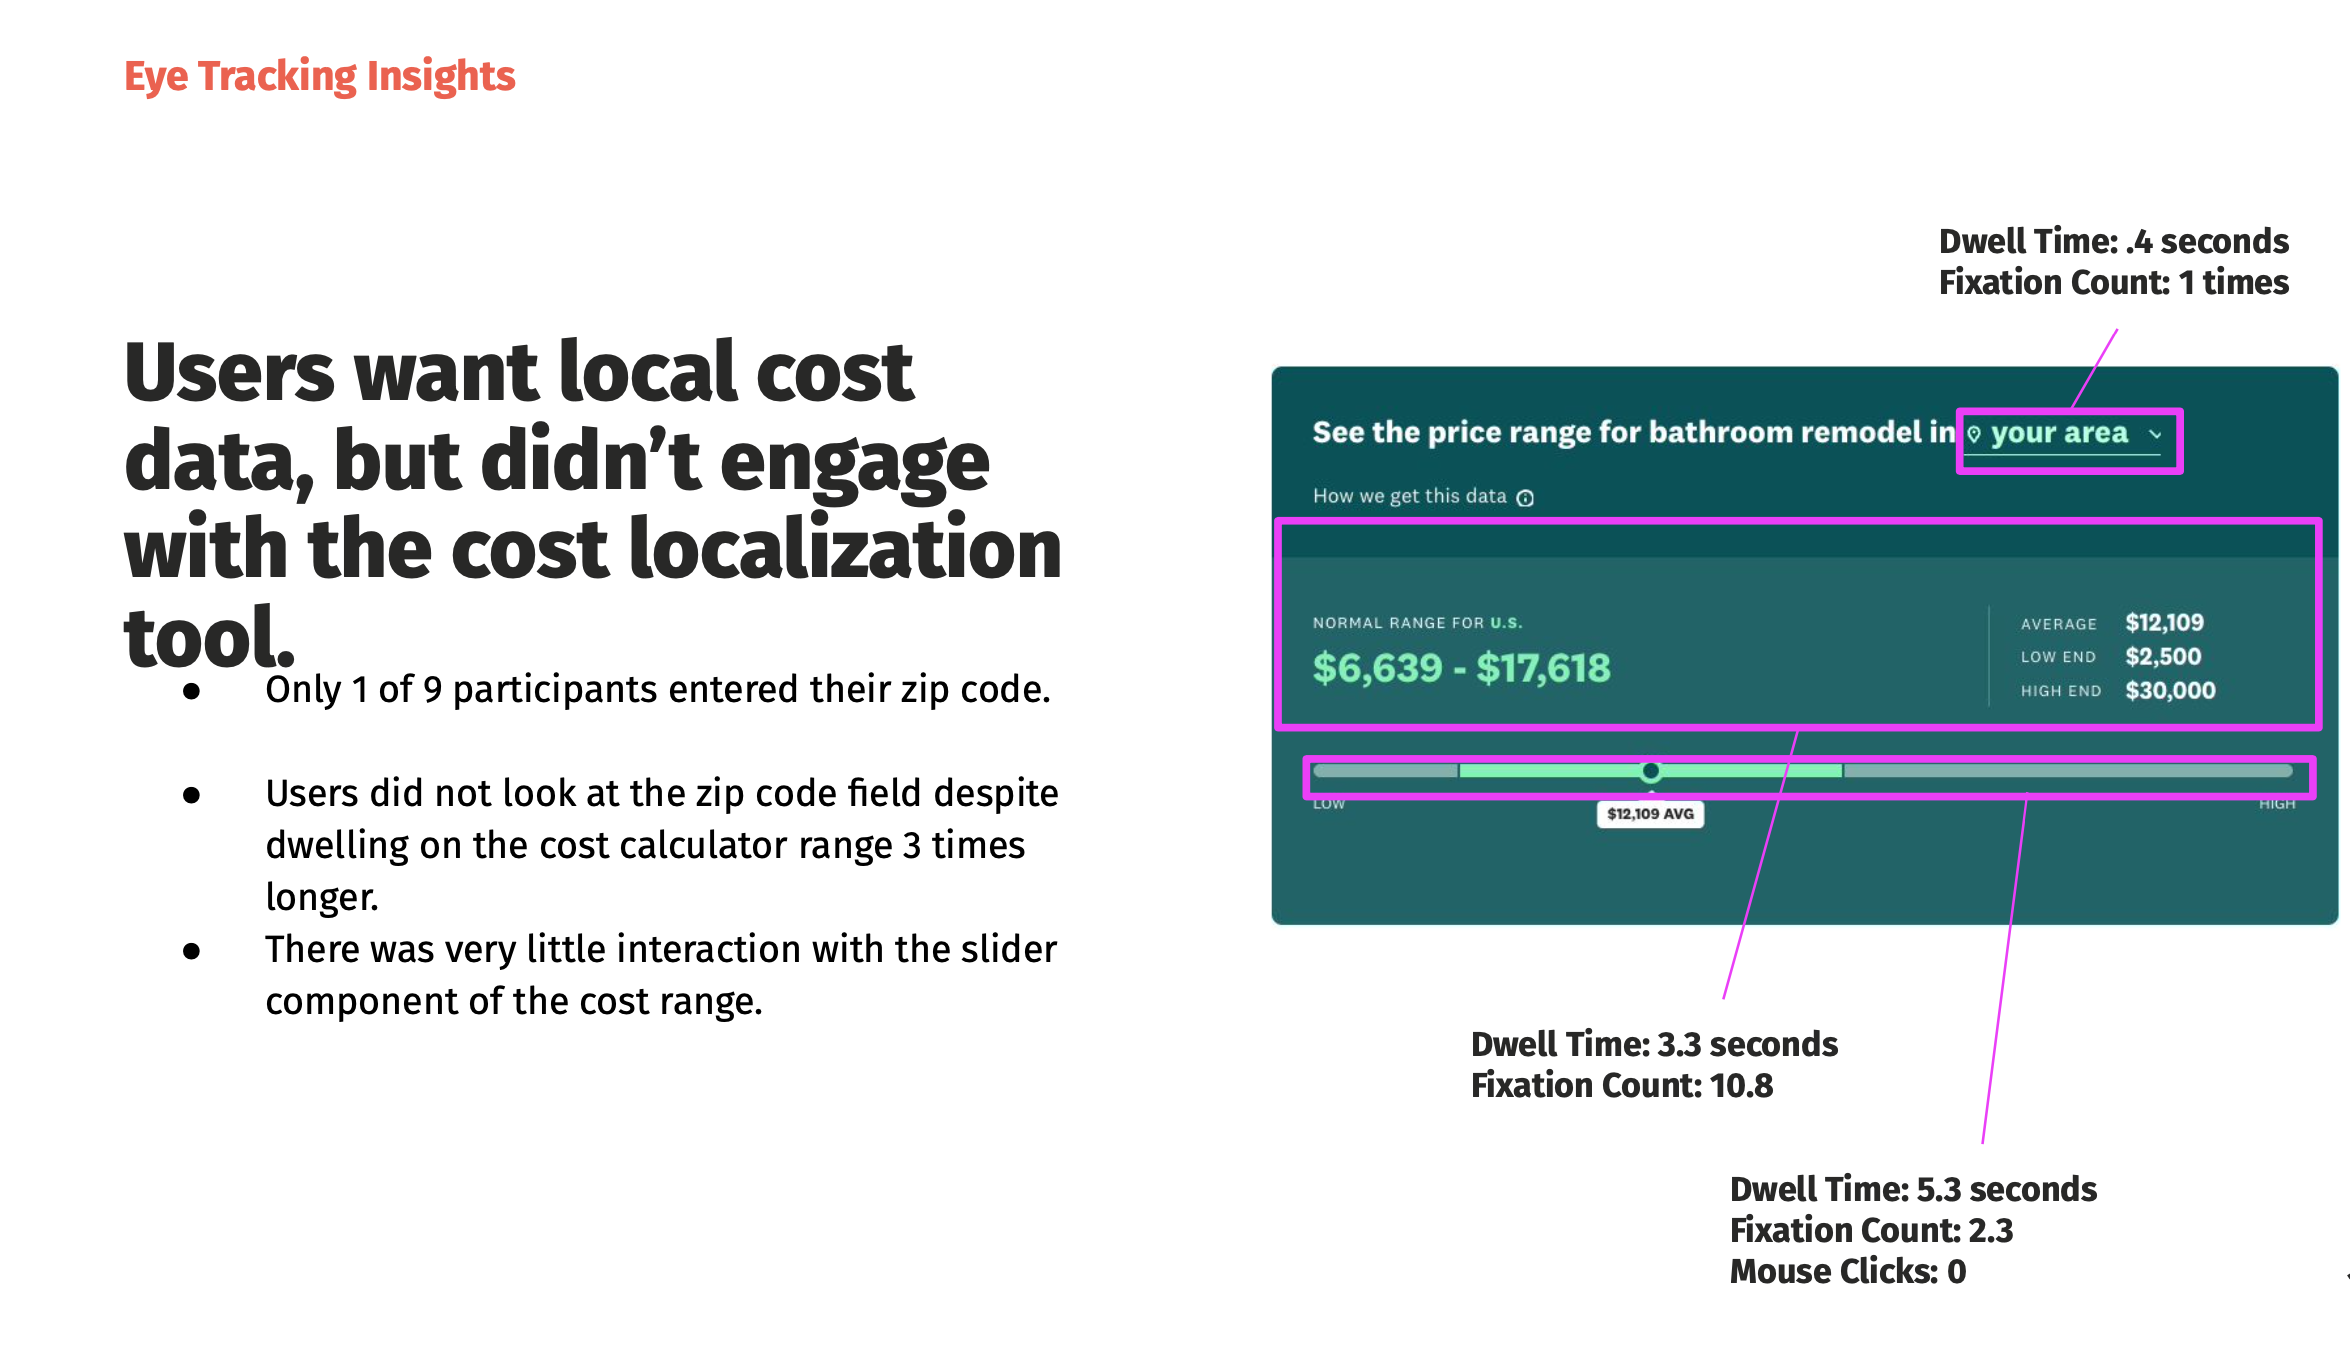
Users strongly wanted localized pricing, yet most failed to notice or understand the cost localization input.
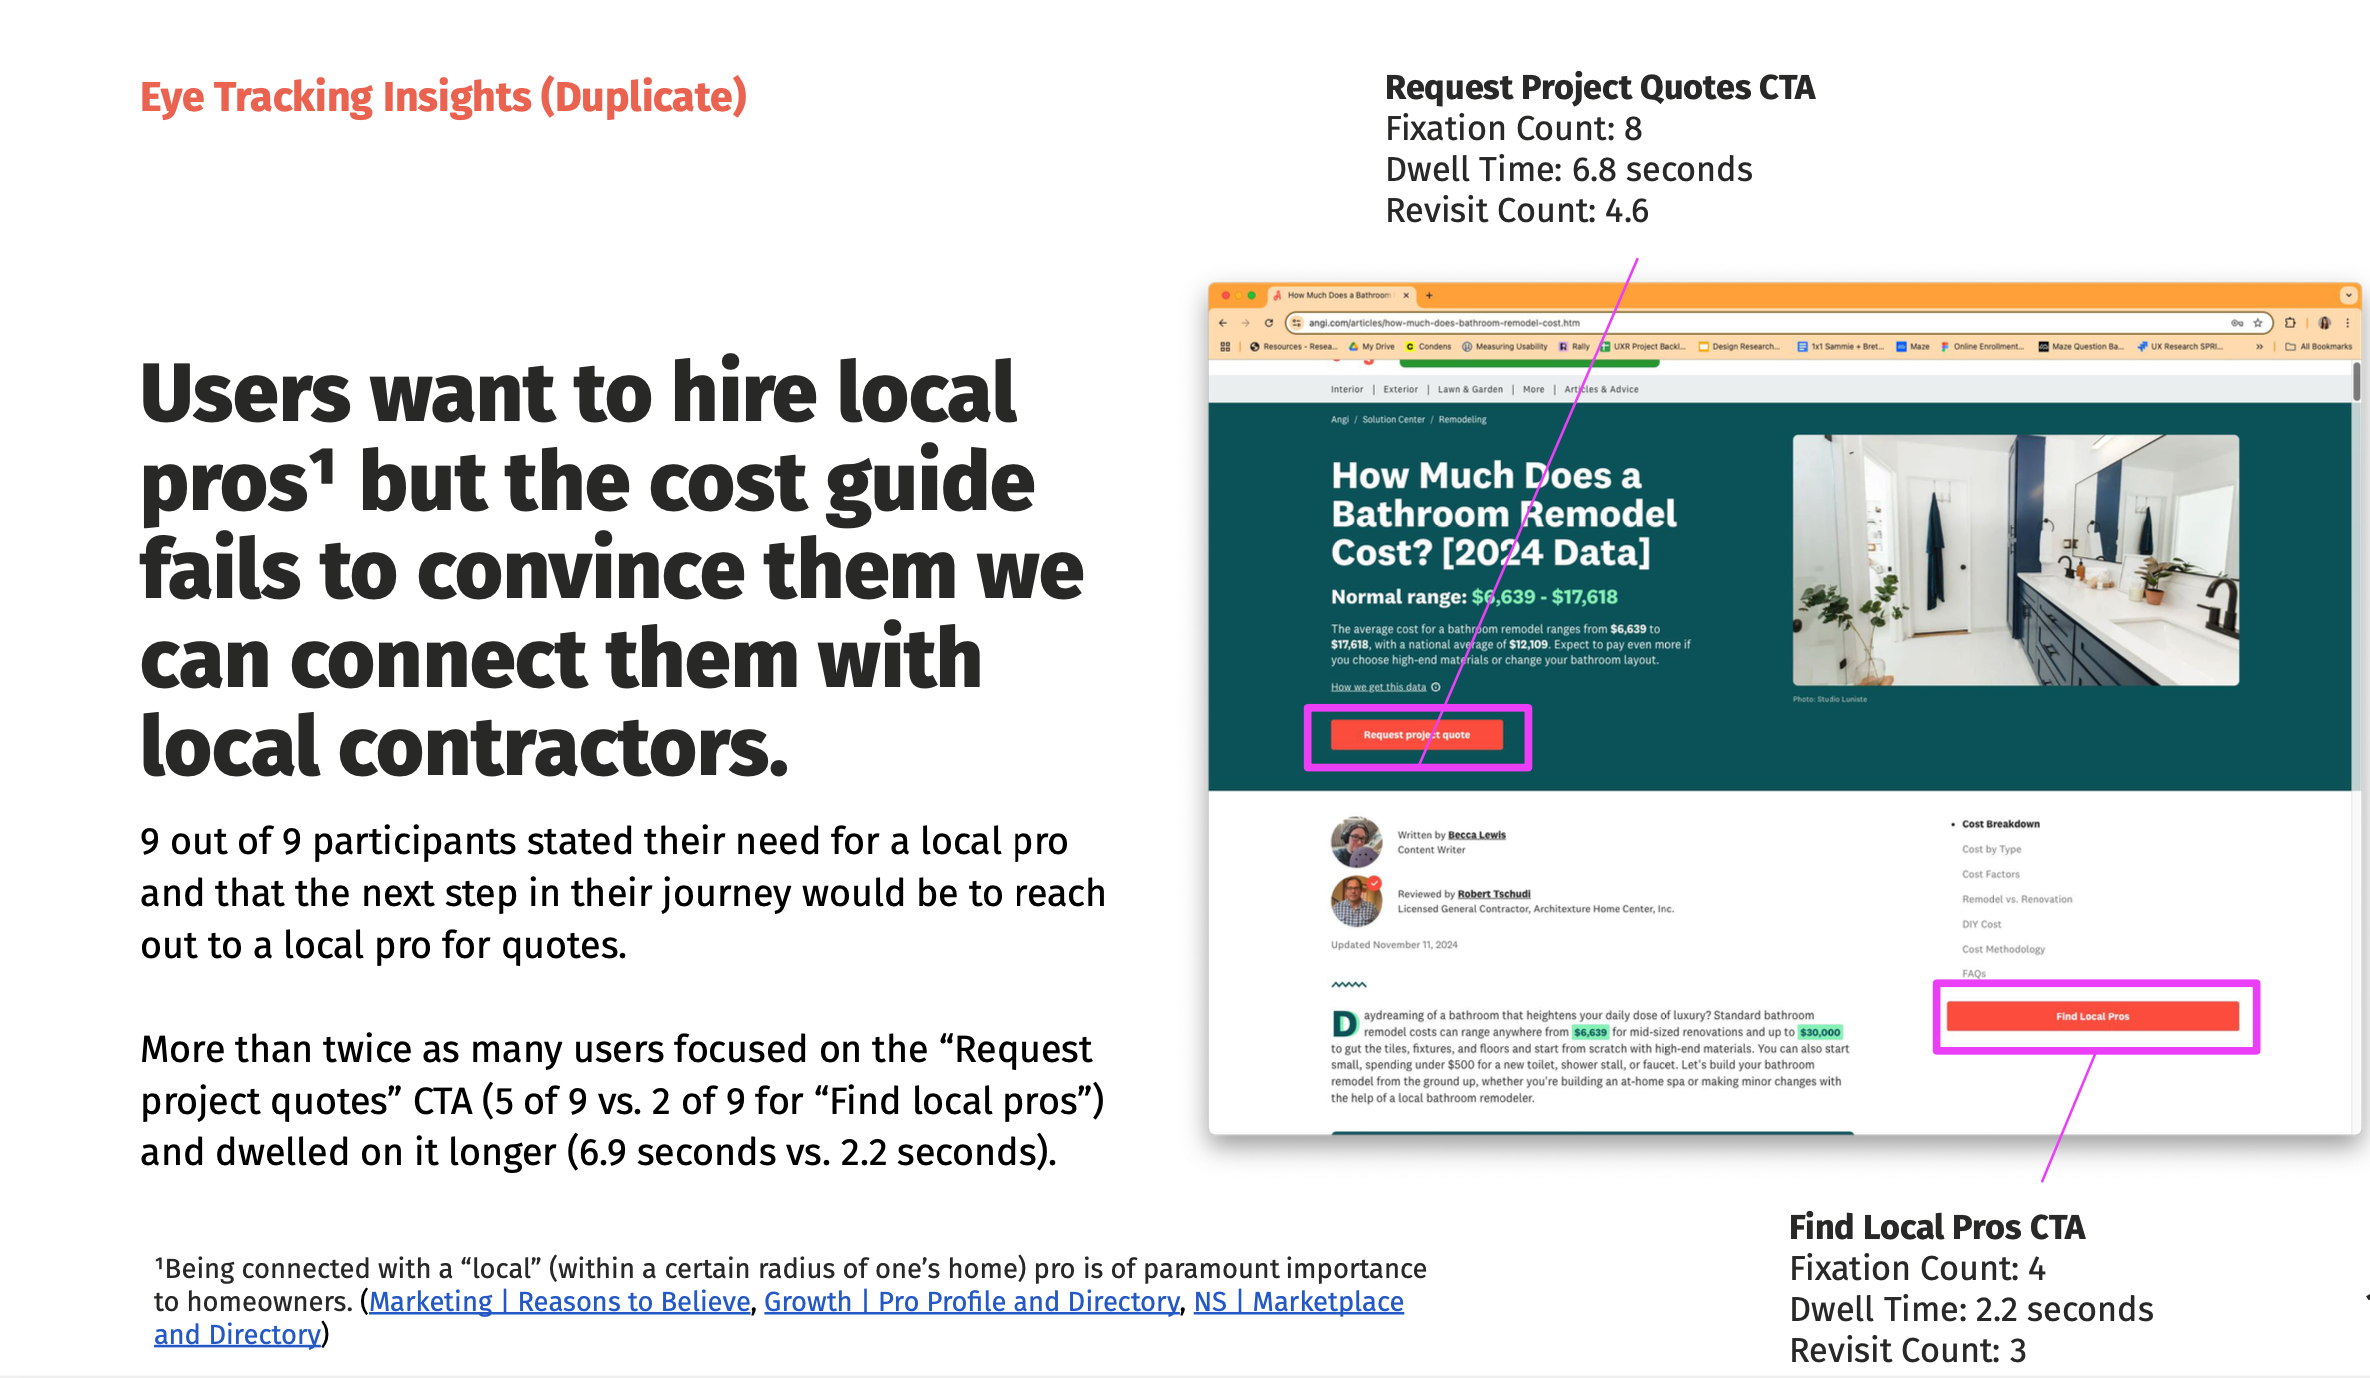
The CTA “request project quotes” received significantly more attention than “Find local pros,” though it also triggered confusion and negative emotion due to unclear expectations.
While users found the guide generally helpful, trust and credibility were low, driven by broad cost ranges, lack of references, and insufficient location-specific detail.
Conclusion
This pilot demonstrated the value of combining biometric data with qualitative research to uncover gaps between what users say, feel, and do. While Angi’s cost guides successfully capture attention and provide helpful baseline information, opportunities remain to improve clarity, trust, and confidence—especially around localized pricing and next-step CTAs.
From a research practice perspective, the study validated iMotions as a powerful complementary tool when paired with traditional UX methods, while also highlighting its limitations and appropriate use cases. The findings informed content, design, and conversion strategy discussions and laid the groundwork for future experimentation and optimization of high-impact content experiences.
Reflections and Next Steps
If this work continued, the next step would be to validate these recommendations through A/B testing and usability studies, measuring improvements in widget engagement, scroll depth, and conversion-to-pro requests. I would also extend this approach to other high-traffic cost guides, using targeted biometric research to prioritize changes that most effectively reduce confusion and increase user confidence at critical decision points.
I recommend the following next steps:
Restructuring the content hierarchy to surface the most critical cost information above the fold, reduce text density, and use progressive disclosure to support scanning and comprehension.
Clearer labeling, instructional microcopy, and stronger visual emphasis for the zip code input to communicate the value of localization and increase interaction with the cost calculator.
Reframe CTA language and add supporting context to clearly set expectations about what happens next, reducing anxiety and improving confidence at the moment of action.
Identify opportunities to add credibility signals—such as references, methodology explanations, and tighter ranges where possible—to improve trust and encourage follow-through.